Half the birth charts made on an AI astrology service are for Gen Z
Of 21,906 birth charts made on GrahAI between April and October 2026, 50.2% were for people born from 1997 to 2012 and 34.8% for millennials. Couples checking compatibility are young too.
By Rahul Dubey, Founder, GrahAI
Published
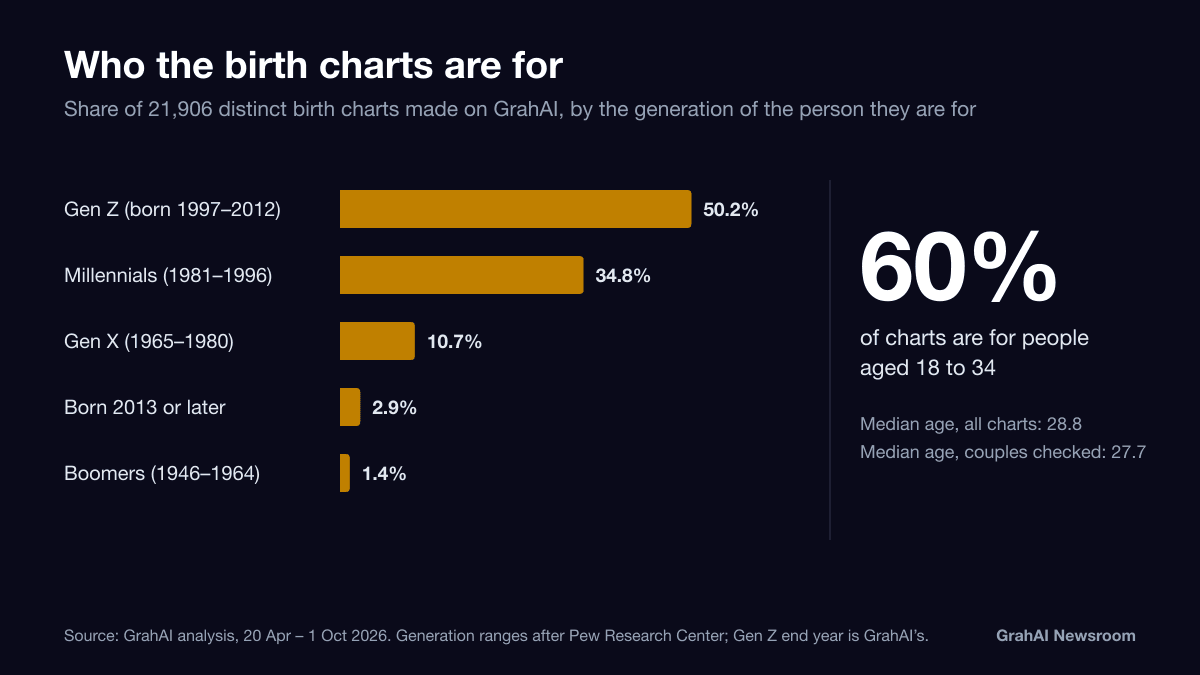
Between 20 April and 1 October 2026, people made 21,906 distinct birth charts on GrahAI’s free kundli tool. Half of them — 50.2% — were for someone born between 1997 and 2012, the generation usually called Gen Z. Another 34.8% were for millennials.
The typical chart is for someone in their late twenties: the median age, on the day the chart was made, was 28.8. Six in ten charts (60.2%) were for people aged 18 to 34, and one in four (26.4%) for 18-to-24-year-olds.
| Generation | Born | Share of charts |
|---|---|---|
| Gen Z | 1997–2012 | 50.2% |
| Millennials | 1981–1996 | 34.8% |
| Gen X | 1965–1980 | 10.7% |
| Boomers | 1946–1964 | 1.4% |
| Children | 2013 or later | 2.9% |
| Older | before 1946 | 0.1% |
Couples checking compatibility are young too
On GrahAI’s kundli matching tool the picture is similar. Across 1,892 couples, the median age of the people being matched was 27.7, and in 54.5% of couples both people were under 30.
Children, older people, and births abroad
8.2% of charts were for people under 18. Our reading is that many of these are made by a parent for a child, though the data cannot show who made a chart. 3.8% were for people aged 55 or over, and 4.5% were for people born outside India.
What this does and does not show
These figures describe who the charts are for. They do not show who made them, and they do not show that younger people are more interested in astrology than older people. India’s population is young, and so are the people who use apps and websites; a young mix of charts may reflect both. Neither is adjusted for here.
What we chose not to measure
Partner age gaps. The matching form has one slot for each partner, and nothing stops the two from being filled the other way round, so any age-gap figure would mix real gaps with swapped entries at an unknown rate. A median age across both partners does not depend on slot order, so that is what is reported.
How the analysis was done
- Charts: every birth chart generated on GrahAI’s free kundli tools from 20 April to 1 October 2026, excluding GrahAI’s own internal and test accounts — 24,898 charts. Repeat charts for the same date, time and place of birth were counted once, leaving 21,906.
- Age: from the date of birth to the day the chart was made. Generation from the year of birth.
- Couples: 1,946 distinct couples from the matching tool. 9 with identical birth details on both sides and 45 with an age under 14 or over 80 were set aside, leaving 1,892.
- Born in India: a birthplace inside India’s bounding box and on India’s +5:30 time offset.
- Privacy: only aggregate counts were produced. Birth details were used in memory to recognise repeat charts and were not exported, and no individual is described.
Limitations
- These are GrahAI users, mostly in India — not a sample of the population or of everyone who consults astrology.
- A chart is often made for someone else, such as a child, partner or parent, so these are the ages of the people the charts are for, not of the people using GrahAI.
- The born-in-India test is approximate. Sri Lanka used India’s +5:30 offset in most years and Nepal did until 1986, so some births there count as India.
Anyone can make a birth chart on GrahAI’s free kundli tool, or check two charts together with kundli matching.
Sources
How this article was made
The figures come from a read-only analysis script run against GrahAI’s own records for the fixed window above; the chart is drawn from the same output. Drafting was AI-assisted, every figure was checked against that output, and Rahul Dubey reviewed the article before publication.
Written by
Founder, GrahAI
Rahul Dubey is the founder of GrahAI. He leads the product — the chart engine, the AI-written reports and the free tools on this site — and writes the company’s announcements and product notes in this newsroom.